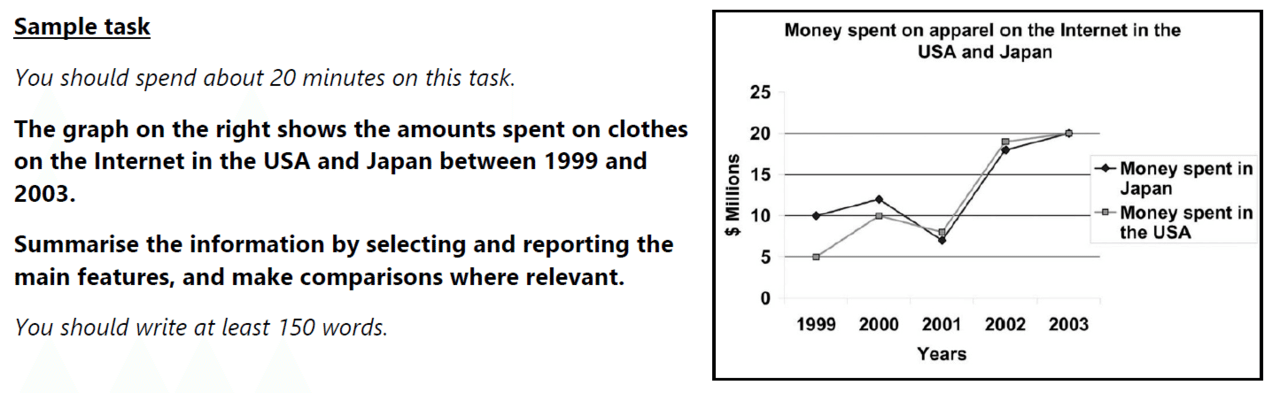
We can see that although at first Japanese customers spent much more money than Americans did, as the years went by, the two countries' spending habits (patterns)had become almost identical (equal, similar).
In 1999, Japan purchased almost twice as much clothing as the U.S. ($10 million vs. $5 million). In the following year, the expenditure on clothes in both Japan and USAgrew even further (increased, rose still further) to12 and 10 million dollars respectively, narrowing (closing) the gap between the two countries.
2001 was the only year in which both countries experienced a sharp decline intheir expenditures, with the U.S. spending $8 million and Japan spending $7 million, the lowest amounts ever recorded.
(この, with~~って頻出です!また本書では2001 was the only year when expenses plunged in both countries, with ~~という表現でした)
In 2002 and 2003, the upward trend resumed, andclothing sales in both countries recovered. In 2002, the U.S. and Japan were close,with the U.S. at about $19 million and Japan at about $18 million. Online clothing sales became even more popularin 2003, reaching a peak of $20 million in both countries.
This bar graph compares the amount ofcoffee and meat consumed each year in Norway, France, Germany, the United States, Russia, Chiana, and Japanin terms of kg per capita.
It can be clearly seen that meat consumption is much higher than coffee consumption in all seven countries.
7カ国ともコーヒーよりも肉の消費量の方が多いことがよくわかります。
The lowest rates of coffee consumption are recordedin china and Japan (2 and 3 kg per person respectively). Three countries with somewhat higher rates are the USA (4 kg per person) and France and Russia, with equal consumption rates of5 kg per person. The highest numbers belong toGermany and Norway, at 7 and 9 kg per person.
The figures for meat are significantly different. The highest meat consumption is in the U.S. (122 kg per capita) and the lowest in Japan (only 42 kg per capita). Russia and China consume about the same amount of meat asJapan, 45 kg and 47 kg per capita respectively. Three other countries have much higher numbers, starting with Norway's 60kg per capita, followed by France's 72kg, Germany eats almost twice as much meat as Japan (87kg).
・25%は”a quarter”、 50%は”a half”、75%は”three quarters”と表現 ・1つ1つのスライスについて比較し、最大・最小については必ず触れる ・他よりも2~3倍高いものがあれば、”twice (three times) as many as Xs were used as Ys”と記述(または”X is much more (or considerably less) common than Y”と書く)
引用:Target Band 7: IELTS Academic Module - How to Maximize Your Score (4th Edition)
【例文:Time stampは過去形】
The pie chart compares book sales in 2001 at a famous bookstore by category (genre), as well as the age group and gender of the customers.
It clearly shows that parenting books werethe most popularand that the biggest proportion of books was sold to the people of child-bearing age between the ages of 25 and 50 for both men and women.
Childcare books (25%) and cookbooks (22%) were the two dominant categories, closely followed by psychology, with only4 percent less than cookbooks. Fantasy and gardening books recordedvery low numbers, at11% and 13% respectively. Books on technology and investing were the least popularcategories, with only 7 percent of sales coming from books on investing and 4 percent from books on technology.
Most of thebooks were sold to women and men in the 25 to 50 age group(23% and 28%, respectively), while women over 50 or under 25 and men over 50 sold about the same number of books (12% and 14%, respectively). In addition, only 9% of the books were phrchased by men under (the age of) 25.

 引用:Target Band 7: IELTS Academic Module - How to Maximize Your Score (4th Edition)
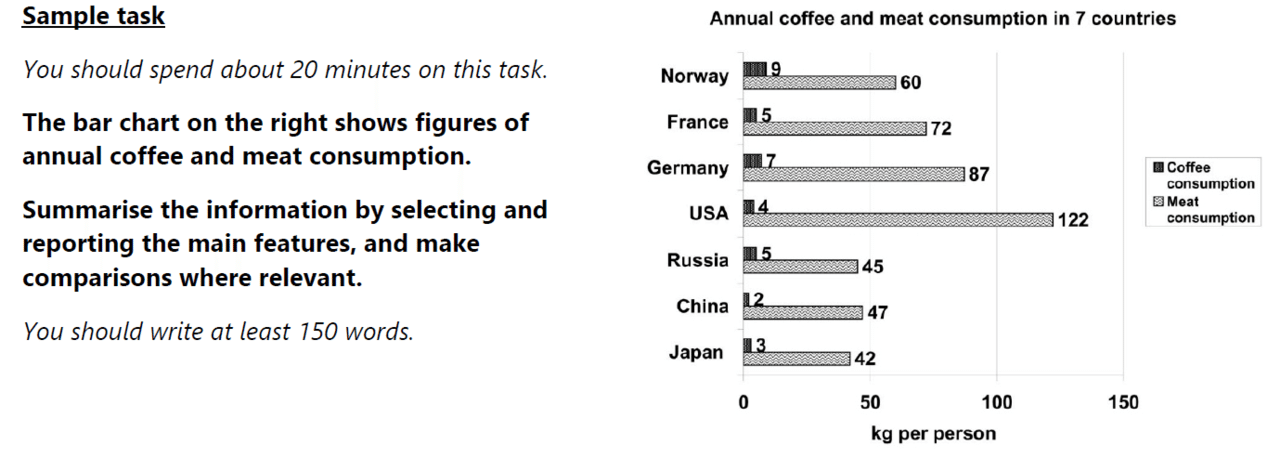 引用:Target Band 7: IELTS Academic Module - How to Maximize Your Score (4th Edition)
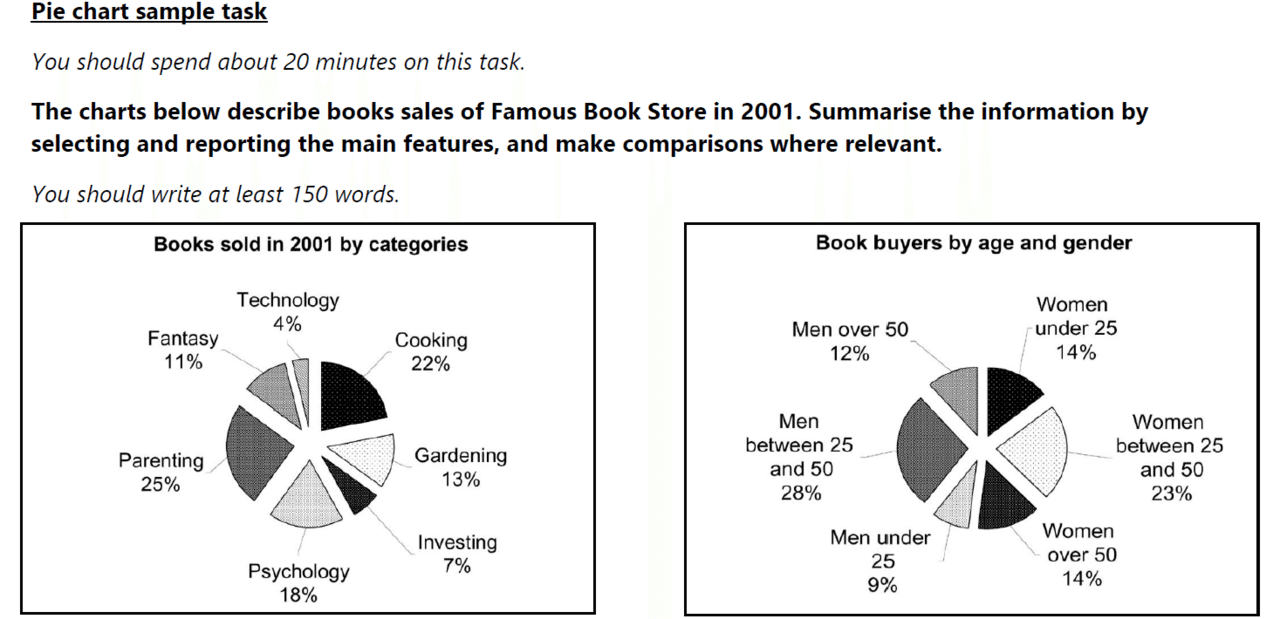 引用:Target Band 7: IELTS Academic Module - How to Maximize Your Score (4th Edition)